Aurora™ · First SaaS Application
The first-ever immersive SaaS platform for collecting, processing, and analyzing location data from smart devices — observing over 17 billion unique geolocation data points every day from 4.4 billion SDK and 6.3 billion RTB mobile advertising IDs (MAIDs) globally, and able to ingest anything with a latitude and longitude.
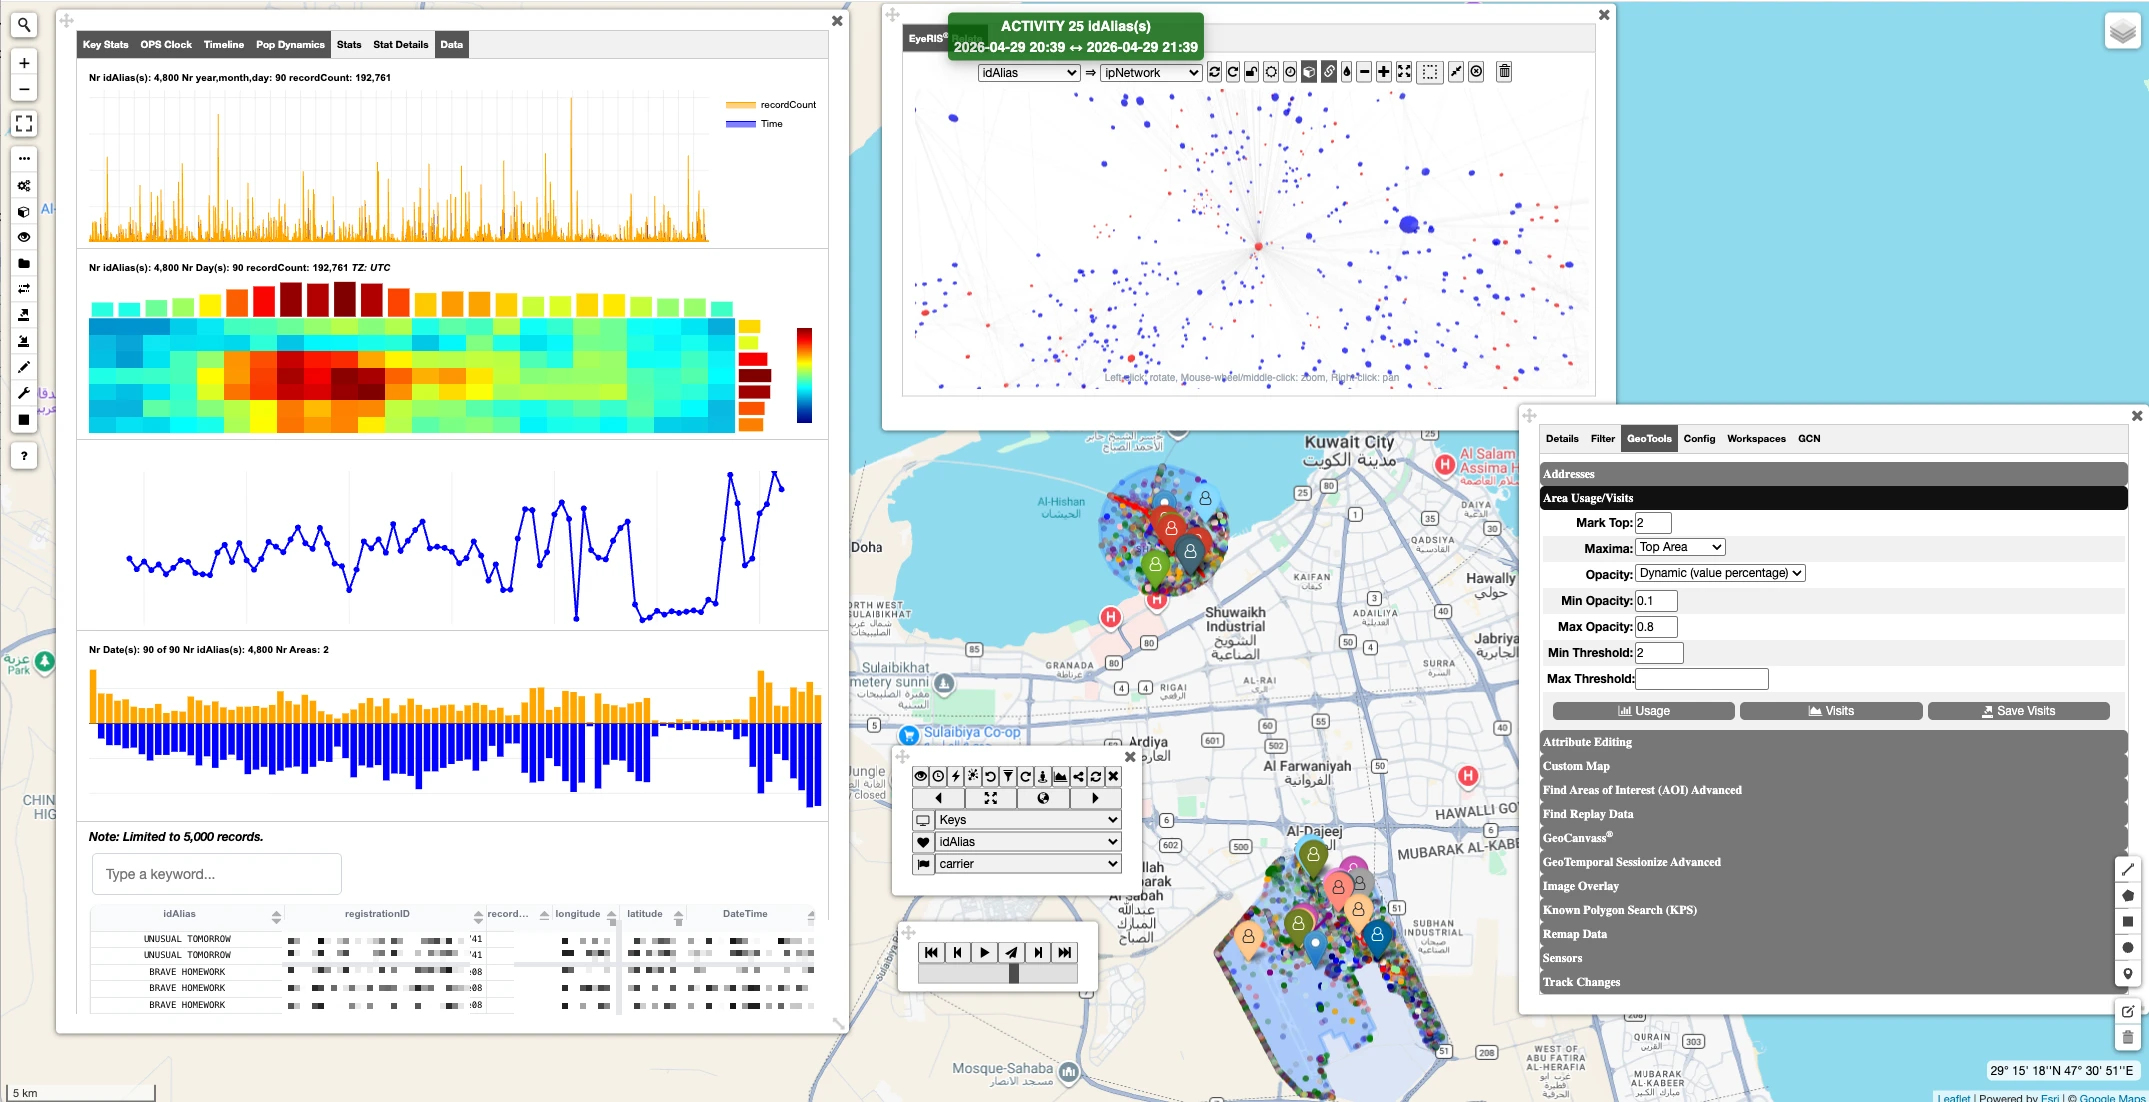
Aurora:GeoStudio® does not rely on an adtech model. It draws on proprietary geolocation metadata from smart-device applications to resolve Internal Device ID, network, country, brand, model, location timeline, IP connection / ISP, and other demographics — then turns that into movement patterns, recurring locations, density change, and co-location events. Because it accepts any latitude/longitude-tagged source, the same environment fuses smart-device data with AIS maritime, flight, telecommunications, and passive-sensor data.
Data Foundation
GeoStudio ingests proprietary device feeds at scale and enriches them with any spatially-referenced data — then makes the whole picture explorable.
Platform Capabilities
Track the movement of a device over time to reveal activity patterns, points of origin, and trends across the full history.
Measure device-activity density across an area and surface the hotspots that indicate significant interest or movement.
Where available, layer demographic context onto device activity for a richer read of who is present and when.
Detailed device attributes — unique ID, network connection, model, and dwell presence — for precise identification.
Enhance raw signal with hashed email, demographics, mobile-app activity, and Mobile Advertising ID (MAID) analysis.
Internet-protocol and service-provider intelligence to support network analysis, attribution, and vulnerability assessment.
Automatically identify clusters of significant activity — potential home or work addresses, meeting places, and co-traveler activity.
Incorporate passive sensors to sharpen device identification within designated zones of interest for real-time presence data.
The GeoAPIs
GeoStudio's analytics are exposed as three composable GeoAPIs. Each returns plain-language analytic labels designed to translate raw location data into prioritized leads and a defensible pattern of life. Together they form a pipeline: capture the area, canvass the event, then run down the device.
The primary collection net. Captures every device observed in a defined area of interest — the initial seed list that feeds the rest of the pipeline.
Feeds GeoRunDown® & GeoCanvass®Cast a wide net over a location and time window, then hand the resulting device list downstream for filtering and pattern-of-life resolution.
record_countoverlimitnrDevicesOutput / nrAreasOutputAnalyzes the devices surrounding a specific event of interest and ranks them by behavioral relevance — separating the few that matter from the crowd.
Elevates leads to GeoRunDown®Apply precise time-and-space analytic filters to a captured population so analysts work the highest-priority devices first.
inMultipleAreaseventDateTimeeventHourAndDayfrequentlyInAreainfrequentlyInAreaDetermines the top recurring "bed-down" locations of an anonymized device — anchoring a device of interest to its likely home, work, and routine.
Resolves the pattern of lifeDevelop an individual device into a structured, defensible pattern of life — the anchor points and temporal rhythm that support traditional investigative methods.
usagerankdaysActive / hoursActivenrDaysOfWeek / nrHoursOfDayspatialLimitDelivery & Governance
GeoStudio integrates as Software-as-a-Service, as an API analytic feed into existing systems, or deployed inside secured environments and enclaves. Spatial limits are enforced in the data itself, and an upgrade path to Aurora:IaaS® fuses GeoStudio with HUMINT, SIGINT, and OSINT for full intelligence fusion.
Use the immersive platform directly, or consume analytic labels as an API feed wired into your existing investigative and operational systems.
Deployable into secured environments for sensitive operational use, keeping data and analysis within your accreditation boundary.
Licensed spatial limits are enforced at the data layer — out-of-bounds locations are removed and clearly flagged via the spatialLimit label.
Aurora:GeoStudio® and the GeoAPIs are available to authorized government, defense, and security organizations. Access begins with a defined mission problem.