Platform Products Aurora™ askAurora™ Aurora:GeoStudio® Capabilities Use Cases Governance C3.ai Request Access

Use Case · Aviation & Major Transport Hubs

Unifying the passenger journey.

A major international airport runs powerful systems that don't talk to each other — Wi-Fi, 3D sensors, CCTV analytics, operational databases. Aurora:GeoStudio® fuses them into a single, live geospatial picture of terminal movement.

Sector: Aviation & Major Transport Hubs Capability: Aurora:GeoStudio® Classification: Unclassified / Illustrative
The Challenge

Powerful systems. No single source of truth.

A modern airport already generates extraordinary data — Wi-Fi access-point logs, 3D overhead sensors, an operational database of flights and gates, and CCTV video analytics. But each system operates in isolation. The result is a fragmented operating picture: no unified view of queues, gate allocation, dwell time, or cross-zonal passenger flow, and no way to proactively manage the terminal in real time.

The Approach

One digital observatory, from disparate silos.

Aurora:GeoStudio® is hardware-agnostic. It normalizes anonymized device metadata, 3D-sensor outputs, and computer-vision feeds onto a single geospatial timeline — preserving the native detail of each source while merging them into one coherent, real-time operational picture. No rip-and-replace; existing infrastructure is fused rather than discarded.
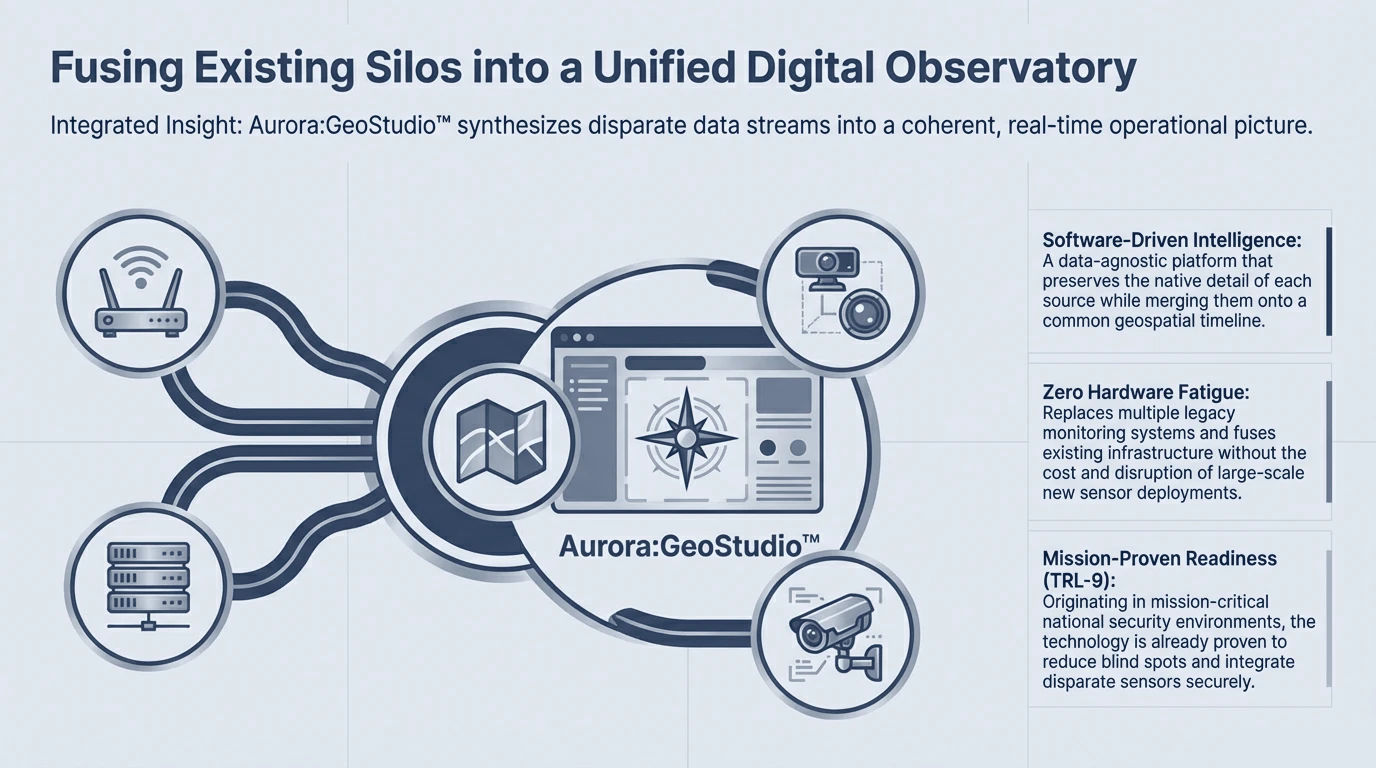
Wi-Fi, server, camera and sensor sources converging into a central Aurora:GeoStudio observatory node producing a unified real-time picture.
Fusing existing silos. Disparate sources — Wi-Fi, operational databases, CCTV, 3D sensors — are synthesized into one coherent, real-time operational picture, without replacing the underlying systems.
The Outcome

A live command center for terminal movement.

Operations, security, and terminal-management teams each get a role-based view of the same live geospatial picture. Toggleable layers overlay Wi-Fi, sensor counts, and cameras on terminal maps with density heatmaps; clickable zones surface average dwell time, entry/exit rates, and capacity; and a historical playback slider replays movement for after-action review.
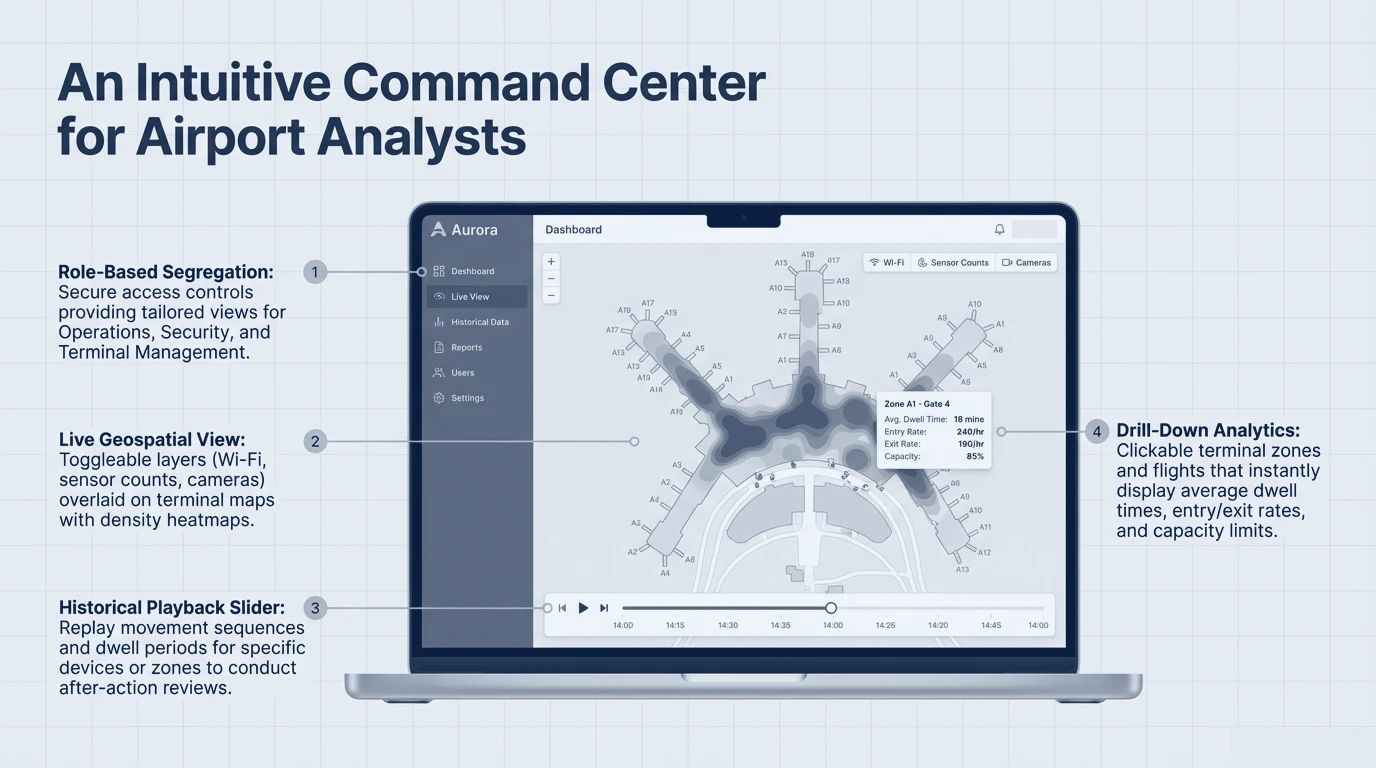
Aurora command-center interface on a laptop showing a terminal map with density heatmaps, a selected gate zone with dwell and capacity stats, and a historical playback timeline.
An intuitive command center. Density heatmaps over terminal maps, drill-down analytics per zone (dwell time, entry/exit, capacity), and a historical playback slider for after-action review.

Three horizons of operational analytics.

The same fused picture serves three time horizons at once: historical pattern discovery from a continuously archived database, real-time monitoring of current conditions and live wait times, and AI-driven predictive alerts that forecast impending congestion from trend extrapolation — enabling proactive intervention before a bottleneck forms.
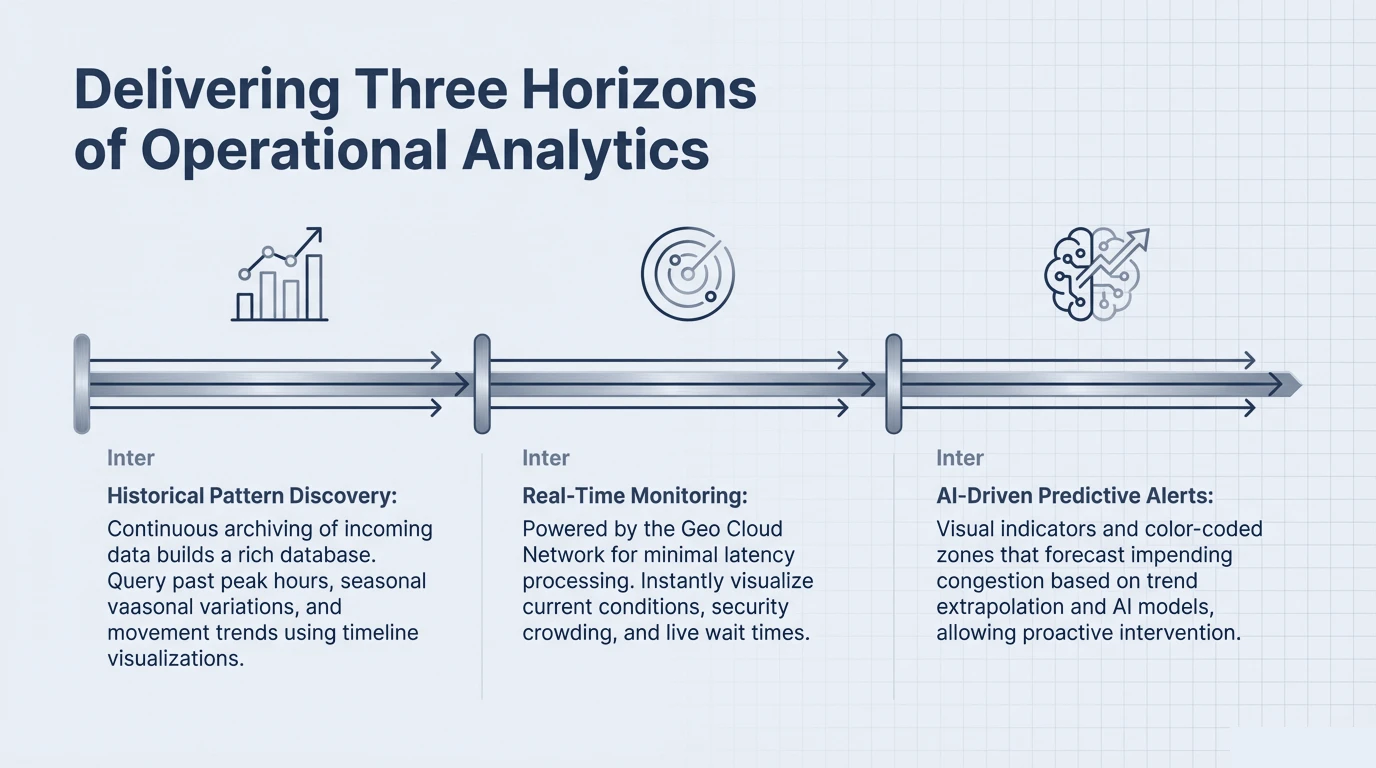
A timeline graphic showing three horizons: historical pattern discovery, real-time monitoring, and AI-driven predictive alerts.
Past, present, and predicted. Historical pattern discovery, real-time monitoring, and AI-driven predictive alerts — delivered from one continuously archived geospatial database.
One picture
Wi-Fi, 3D sensors, CCTV & operational data, fused
Role-based
Tailored views for ops, security & terminal management
Predictive
Congestion forecast before bottlenecks form
Note on sourcing. This case study is drawn from a partner engagement with a major international airport. Customer, partner, and vendor identities have been removed and generalized; figures are illustrative of the analytical method. Reproduced visuals have had third-party names redacted.

Unify your operational picture.

Aurora:GeoStudio® is available to authorized operators of major transport hubs and critical facilities. Access begins with a defined mission problem.